⚡
Power Line Monitoring Solution
Autonomous UAV-Based Transmission Line Inspection & Defect Detection
95%+
Detection Accuracy
80%
Time Reduction
24/7
Autonomous Operation
<5s
Defect Detection
Solution
RAVAM – A New Era of Predictive Maintenance
End-to-End Solution
RAVAM offers a comprehensive AI-powered solution for automated VLS monitoring, from data acquisition to actionable insights.
Advanced Technology
Our proprietary sensor fusion and AI-driven analytics detect defects with unprecedented accuracy and speed.
Real-Time Monitoring
Get a comprehensive, near real-time view of your entire network with automated defect detection and reporting.
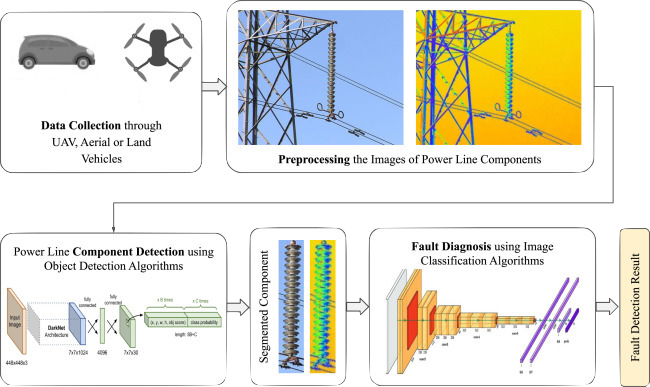
Data Acquisition → AI Analysis → Actionable Insights.
How It Works:
The RAVAM 3-Step Process
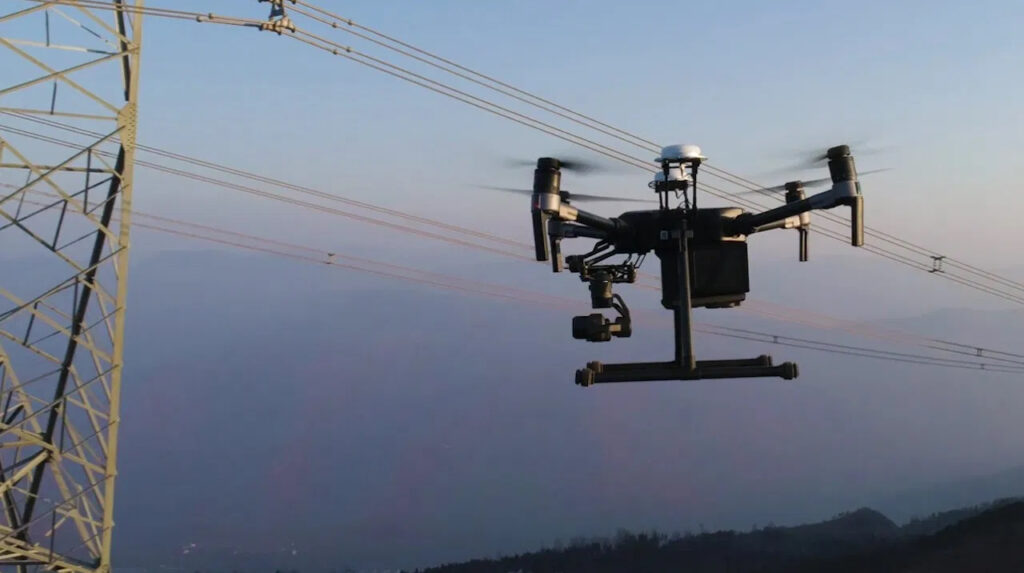
1. Data Acquisition
High-resolution aerial imagery (AFS) with resolution up to 2 cm/pixel for pole-by-pole inspection
LiDAR data for precise 3D terrain modeling
Precision GNSS for sub-10cm accuracy using PPK method
Automated data ingestion into unified storage
2. AI Analysis
Automated defect recognition on VLS support structures
Detection of violations within VLS protection zones
Identification of vegetation encroachment (trees over 4m)
Analysis of wire sag, clearance, and insulator condition
3. Actionable Insights
Interactive cartographic interface for data visualization
Automated generation of structured reports (CSV, XLSX, DOCX, KML)
Pole-by-pole inspection records with defect statements
Prioritized maintenance recommendations
Key Capabilities
🔍
Multi-Sensor Inspection
RGB cameras (50MP), thermal imaging (-40°C to +550°C), LiDAR (±2cm accuracy) for comprehensive line assessment.
🧠
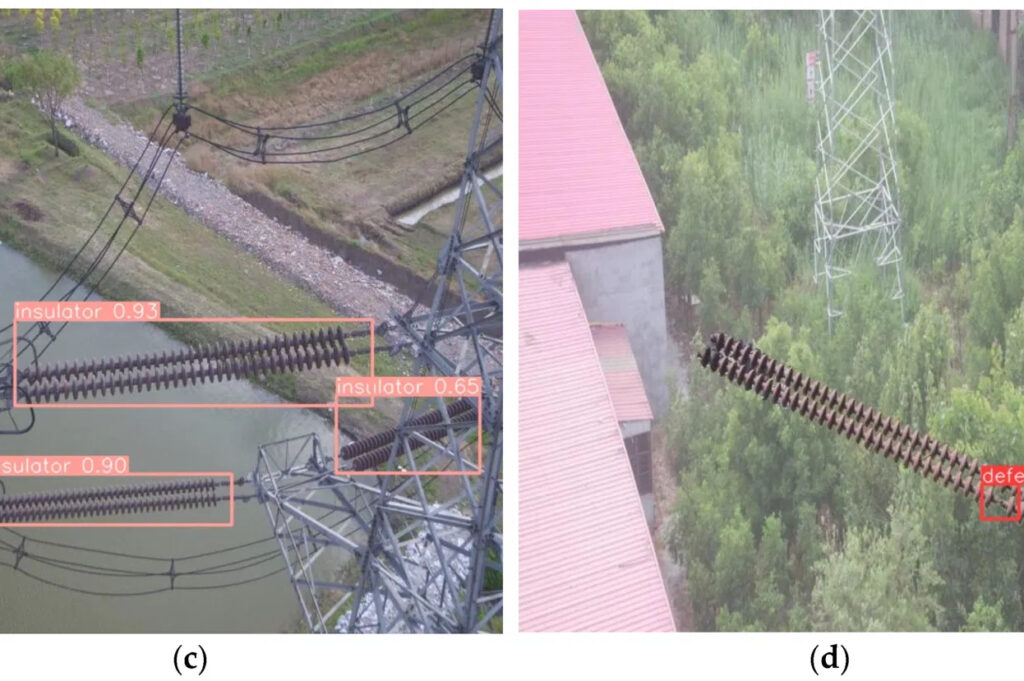
AI Defect Detection
Computer vision models trained on 100,000+ defect images for automatic classification of corrosion, breaks, and hotspots.
📡
Real-Time Monitoring
Live data streaming with instant alerts for critical defects, ensuring rapid response to emergencies.
🔍
3D Mapping
Generate detailed 3D models of your entire network with resolution requirements of 5cm/pixel for general analysis and 2cm/pixel for pole-by-pole inspection.
🔮
Predictive Maintenance
Machine learning models forecast equipment failures weeks in advance based on thermal and visual trend analysis.
📡
Automated Reporting
Generate detailed inspection reports with GPS coordinates, defect classifications, and priority recommendations.
Technology Stack
RAVAM delivers comprehensive solutions for infrastructure monitoring and autonomous exploration, powered by advanced AI and multi-sensor fusion.
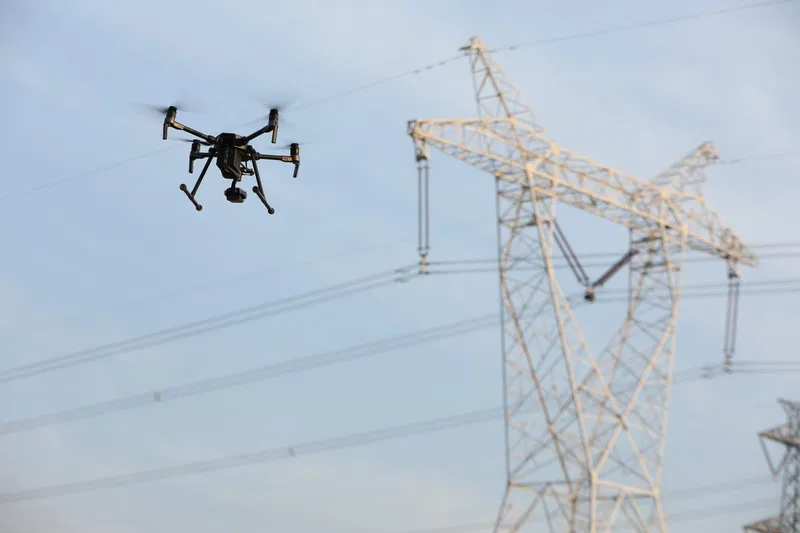
🛸 UAV Platforms
- Multi-rotor drones for detailed inspections (45min flight time)
- Fixed-wing drones for long-distance corridors (520min range)
- Hybrid VTOL for combined versatility (180min flight)
- Autonomous navigation with obstacle avoidance
- Weather-resistant design (15 m/s wind tolerance
📷 Sensor Suite
- 50MP RGB cameras with 30x optical zoom
- Thermal imaging: 640×512 resolution, ±2°C accuracy
- LiDAR: 300,000 points/sec, ±2cm accuracy, 200m range
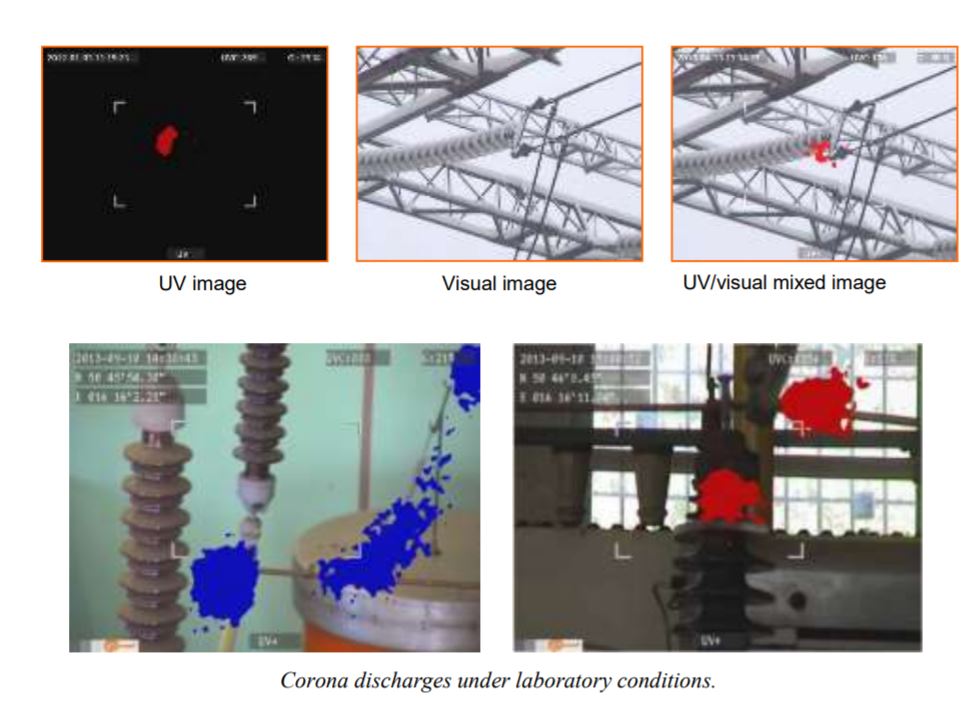
- Corona discharge (UV) detection cameras
- RTK-GPS for ±1cm positioning accuracy
🧠 AI & Analytics
- Deep learning models for defect classification
- Thermal anomaly detection (<5 sec processing)
- Conductor sag measurement and analysis
- Vegetation encroachment mapping
- Predictive failure modeling (weeks advance warning)
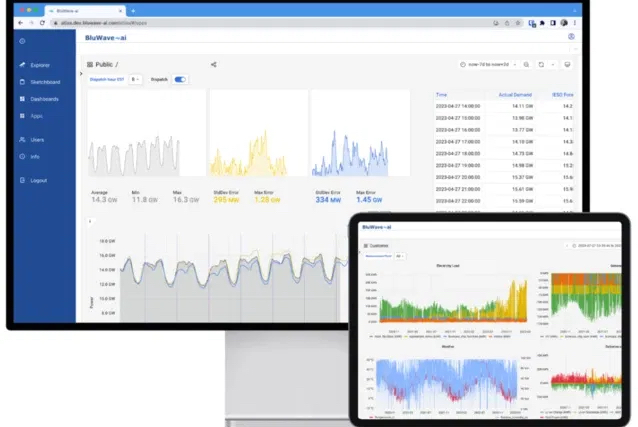
☁️ Data Platform
- Cloud-based data storage and processing
- Real-time dashboard with live alerts
- Historical trend analysis and comparison
- API integration with existing SCADA systems
- Automated report generation (PDF/Excel)
Benefits
Benefits
💰 Cost Reduction
Reduce inspection costs by 60-70% compared to traditional helicopter or manual inspections. Minimize downtime with predictive maintenance.
⚡ Reliability Enhancement
Identify defects before they cause outages. Continuous monitoring prevents cascading failures and ensures grid stability.
🛡️ Safety Improvement
Eliminate worker exposure to high-voltage equipment and dangerous heights. Zero accidents during inspection operations.
📈 Data-Driven Decisions
Access comprehensive historical data for asset management, capital planning, and regulatory compliance reporting.
Real-World Results
Transforming Grid Management: Expected Outcomes.
“By implementing AI-powered inspection systems, power companies have seen a significant reduction in technological disruptions due to undetected defects, with some reporting up to 40% fewer outages in the first year alone.”
— Industry Analysis Report, 2024
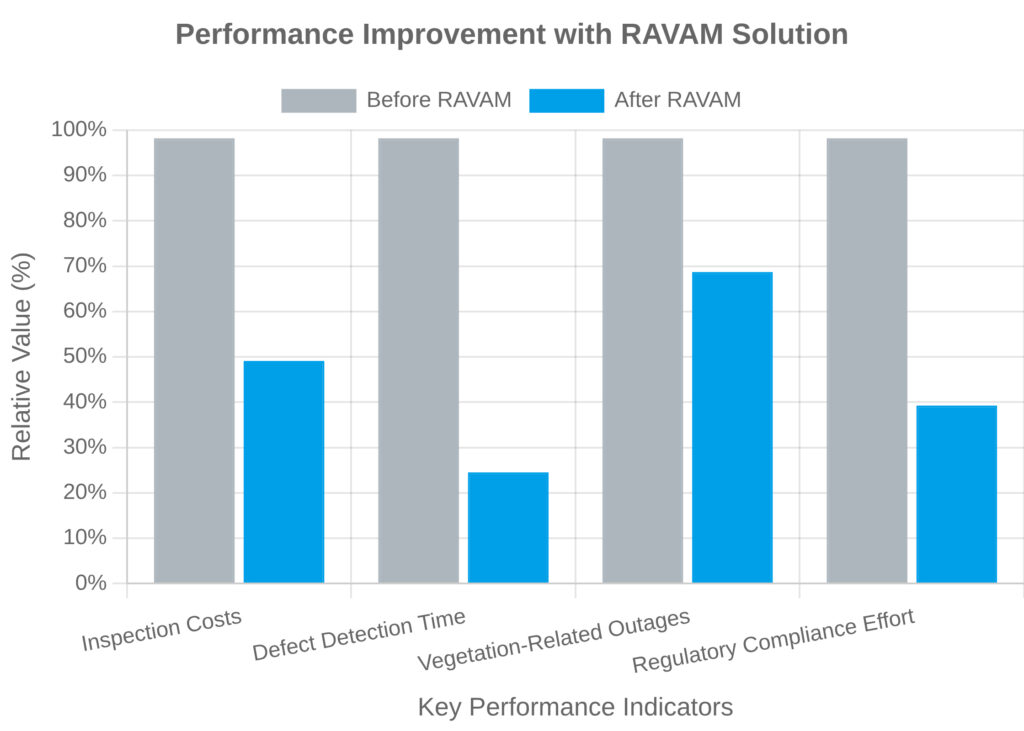
50% Reduction in Inspection Costs
Automated UAV data collection and AI analysis significantly reduces labor hours and equipment costs compared to traditional manual inspections.
75% Faster Defect Detection
Our AI processes inspection data in hours rather than days or weeks, allowing for rapid identification and prioritization of critical issues.
30% Reduction in Vegetation-Related Outages
Precise identification of vegetation encroachment enables proactive maintenance before trees can damage power lines or cause outages.
100% Regulatory Compliance
Comprehensive documentation and standardized reporting ensure full compliance with regulatory requirements for VLS inspection and maintenance.
The Proposal: A Phased Approach
A Partnership for the Future

Phase 1: Pilot Program (3-6 months)
Scope:
50 km of your critical 110kV and 220kV lines, focusing on areas with high vegetation density and historical maintenance challenges.
Deliverables:
Complete data acquisition using UAVs
AI-powered defect detection and analysis
Interactive cartographic interface setup
Comprehensive reports and defect statements
Objectives:
Demonstrate solution effectiveness
Validate accuracy of AI detection
Calculate ROI based on pilot results
Train your team on the platform
Phase 2: Full-Scale Deployment (12-18 months)
Scope:
Rollout across your entire VLS network, with prioritization based on criticality and maintenance history.
Deliverables:
Complete system integration with existing GIS
Customized reporting templates
Automated defect detection for all VLS assets
Ongoing support and maintenance
Objectives:
Achieve full operational efficiency
Implement predictive maintenance capabilities
Reduce inspection costs by up to 50%
Ensure 100% regulatory compliance
01
Schedule a Demo
Experience our platform in action with a personalized demonstration of the RAVAM solution.
02
Define Pilot Scope
Together, we’ll identify 100km of your most critical 110kV and 220kV lines for the initial pilot.
03
Finalize Partnership
Complete the partnership agreement and begin implementation of the RAVAM solution.
Use Cases
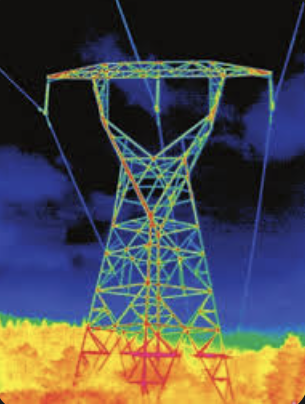
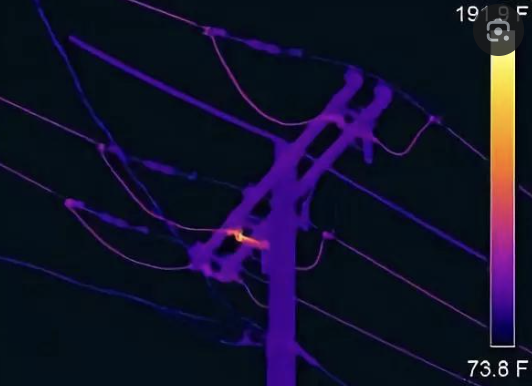
Hotspot Detection
Thermal imaging identifies overheating connectors, insulators, and transformers before failure occurs.
AI Defect Detection
High-resolution RGB imaging detects rust, corrosion, and material degradation on towers and conductors.
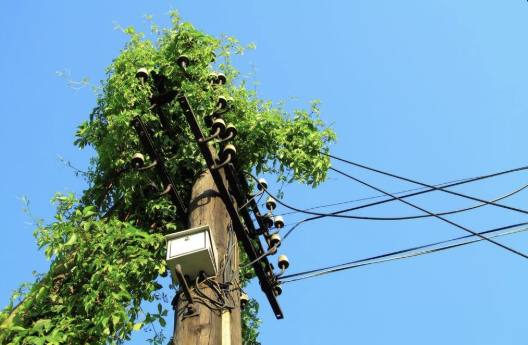
Vegetation Management
LiDAR mapping measures clearance distances and identifies encroaching trees requiring trimming.
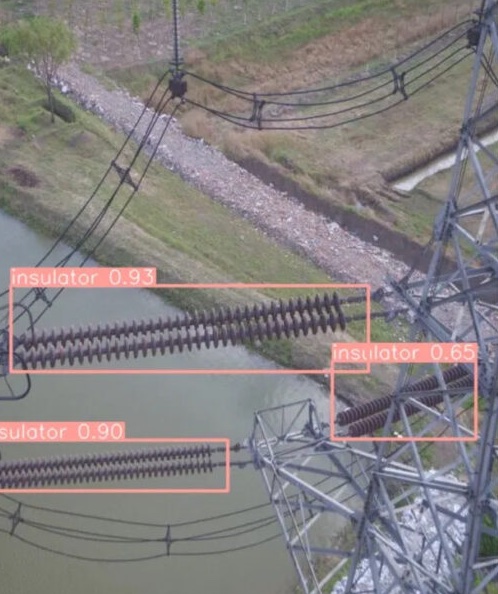
Multi-Sensor Inspection
Detect cracked, broken, or contaminated insulators that could cause flashovers or outages.
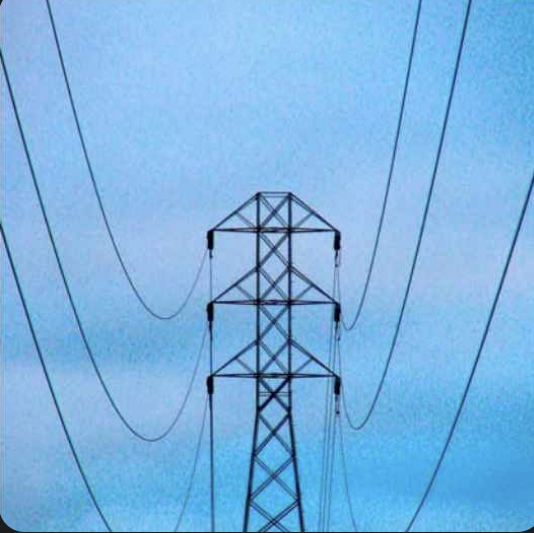
Conductor Sag Analysis
Monitor conductor clearance heights and sag variations to ensure safety and compliance.
Corona Discharge Detection
UV cameras identify corona discharge indicating insulation breakdown or high-voltage issues.
Ready to Transform Your Power Grid Monitoring?
Schedule a demo to see our autonomous inspection platform in action.